The streak ended in August.
From January through July, every month of 2026 had more home sales in Harrisonburg and Rockingham County than the same month in 2025. August broke that run: 115 sales, compared to 133 last August, a 14% drop.
That sounds like a headline, and in some ways it is. But the rest of the data tells a more measured story. Several key segments are still showing modest price growth, homes are still selling quickly, and the year as a whole is still ahead of the last few. Here’s the full picture, and what it means if you’re thinking about buying or selling this fall.
Sales: a slow August inside a strong year
Even with August’s dip, more homes sold over the past 12 months than in the 12 months before that. Our area is still on pace for its highest annual sales total in three years.
The question is what comes next, and the best clue is contract activity.
Contracts: the slowdown started earlier
Over the past four months, 438 contracts were signed, compared to 524 in the same stretch last year. That’s about 16% fewer.
Contract activity shows up in closed sales later on. Slower contract activity over the past four months helps explain why closings have cooled, and I expect September sales to come in light as well.
Prices: flat overall, rising where it counts for most owners
Across all home types (detached and attached, new and resale), the median sales price for the past 12 months was $345,000, down from $349,000 in the prior 12 months. That’s a 1% decline. Over the past six months, prices were essentially unchanged, and August alone came in about 1% above last August.
Break the market into segments and the picture shifts:
- Detached homes: the median price rose 2%, from $390,000 to $399,000, over the past year, on about 1% fewer sales.
- Resale (existing) homes: the median price also rose 2%, from $350,000 to $357,500, and the number of resale homes sold rose 6%.
So while the overall median is down 1% for the year, the detached and existing-home segments are each up 2%.
Where the 1% dip is coming from
If detached homes and resale homes are both up 2%, why is the overall median down 1%? Mostly because of what’s selling, not because of a broad decline across the market.
The most recent breakdown by home type covers the first half of 2026:
- Attached homes (townhomes, duplexes, and condos) had the biggest jump in sales, up 25%, from 228 to 284. Their median price slipped 2%, to about $315,000.
- New homes sold 10% more often, and their median price fell 5%, to about $325,000. Most new homes selling in our area are townhomes, which is why that figure sits so close to the attached median.
- Detached homes, by comparison, had a median of $399,000.
So in the first half of 2026, a bigger share of sales were attached homes and new townhome-style construction, with medians $75,000 to $85,000 below the detached median. That first-half mix helps explain why the overall median can slip even while detached and existing-home prices rose.
The practical takeaway: over the past 12 months, detached and existing-home medians are up about 2%. In the first-half breakdown, attached homes were down about 2% and new homes were down about 5%.
For longer-term context: the median detached home price rose 62% from 2019 to 2024. Over the past two years it has risen about 3% in total. Prices are still moving up, just at a very different pace than the run-up years.
Days on market: a little slower, still fast
Median days on market rose by one day year over year, to 8 days from 7. Homes are selling a bit more slowly, but a typical home in our area is still going under contract in about a week.
Inventory: rising, but still below last year
Fewer contracts leave more homes on the market, and inventory has mostly risen over the past six months. Even so, the number of homes for sale is still lower than it was a year ago. Buyers have somewhat more to choose from than they did this spring, not a flood of options.
Mortgage rates: part of the explanation
Rates have climbed over the past six months. The 30-year fixed rate averaged 6.66% at the end of August and 6.76% in Freddie Mac’s September 10 survey, up from 6.71% the week before. A year ago it was 6.35%. The 15-year fixed averaged 6.09%.
To put that in monthly terms: on a $345,000 home with 20% down, principal and interest at 6.76% comes to about $1,792 a month, compared to about $1,717 at 6.35%. That’s roughly $75 more every month for the same house. (Illustration only. It leaves out taxes, insurance, and any HOA dues, and your rate depends on your own loan.)
If you’re buying
- You may have a little more choice than earlier this year, and some homes are sitting long enough to give you time to think.
- Run the payment before you shop. At current rates, know the monthly number you’re comfortable with, not just the loan amount you qualify for.
- Don’t expect a bargain market. Median days on market is still about a week. When the right home comes up, be ready to act.
If you’re selling
- Price realistically from recent, truly comparable sales. With contracts slowing, realistic pricing matters more.
- Take reasonable offers seriously. Be ready to move forward when a qualified buyer makes an offer with reasonable terms.
- Detached and resale median prices are still up 2%, but the gains are modest.
The bottom line
August was a slow month inside a solid year. Sales and contracts are cooling, inventory is creeping up, and higher rates are part of why. At the same time, detached and resale prices are still up 2% and homes are still selling in about a week. This is a market that’s leveling off, not falling.
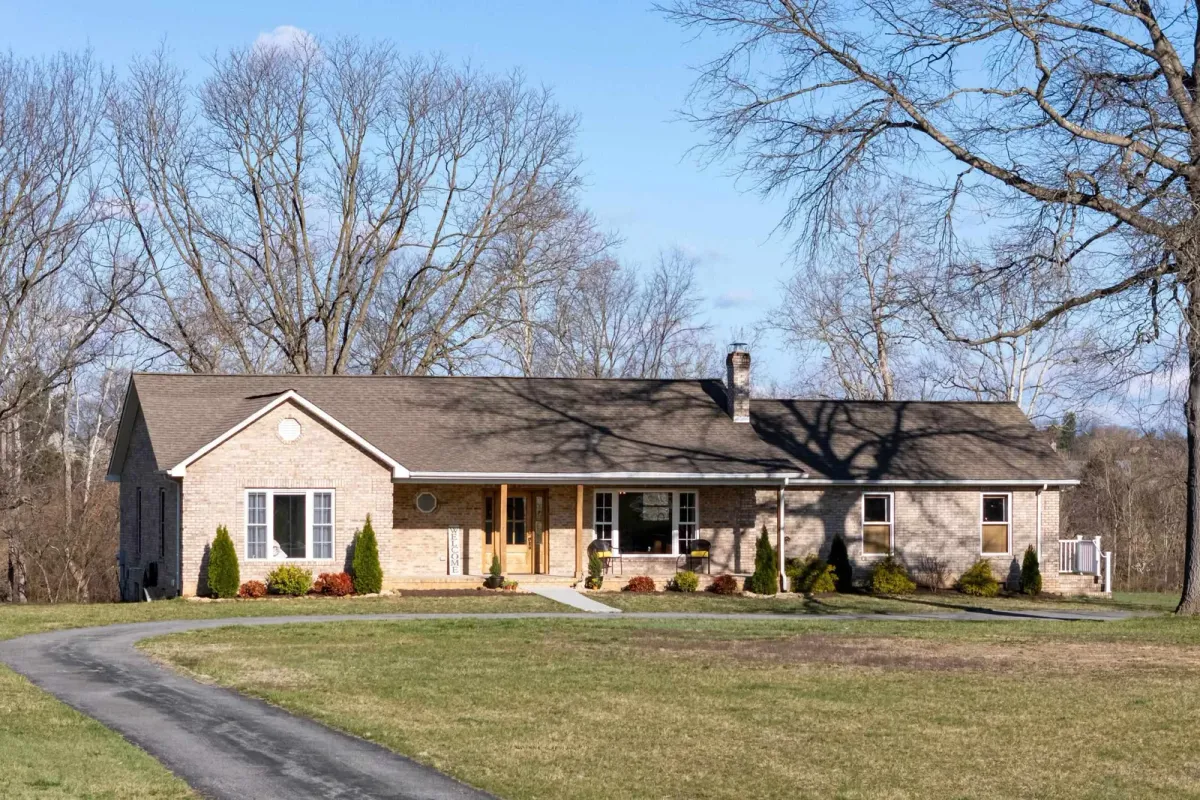
Featured listing: 901 Riverside Ave, Grottoes
One of my own listings in Rockingham County is a good example of what’s on the market right now.
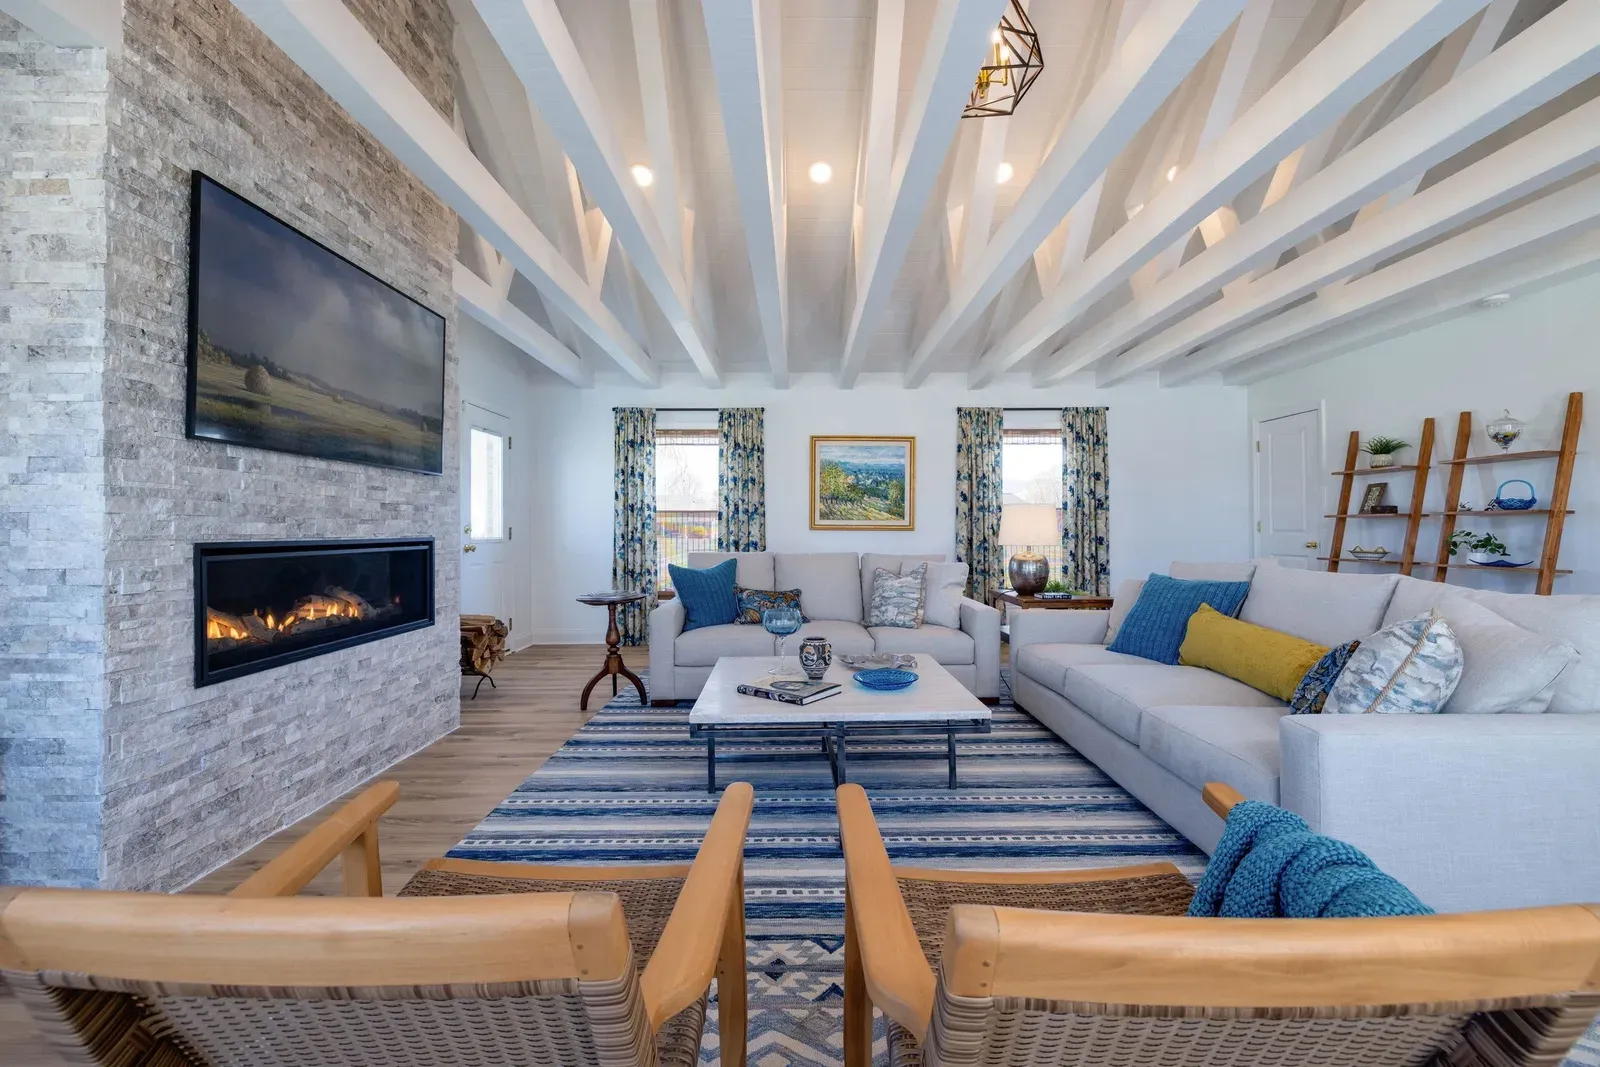
The inside is the headline here. The home was fully renovated in 2024, and the great room pairs a beamed ceiling with a stone fireplace.
- Price: $749,900
- Size: 5 bedrooms, 3 bathrooms, about 3,336 square feet
- Lot: about 1.5 acres with frontage on the South River
- Built: around 2003, fully renovated in 2024
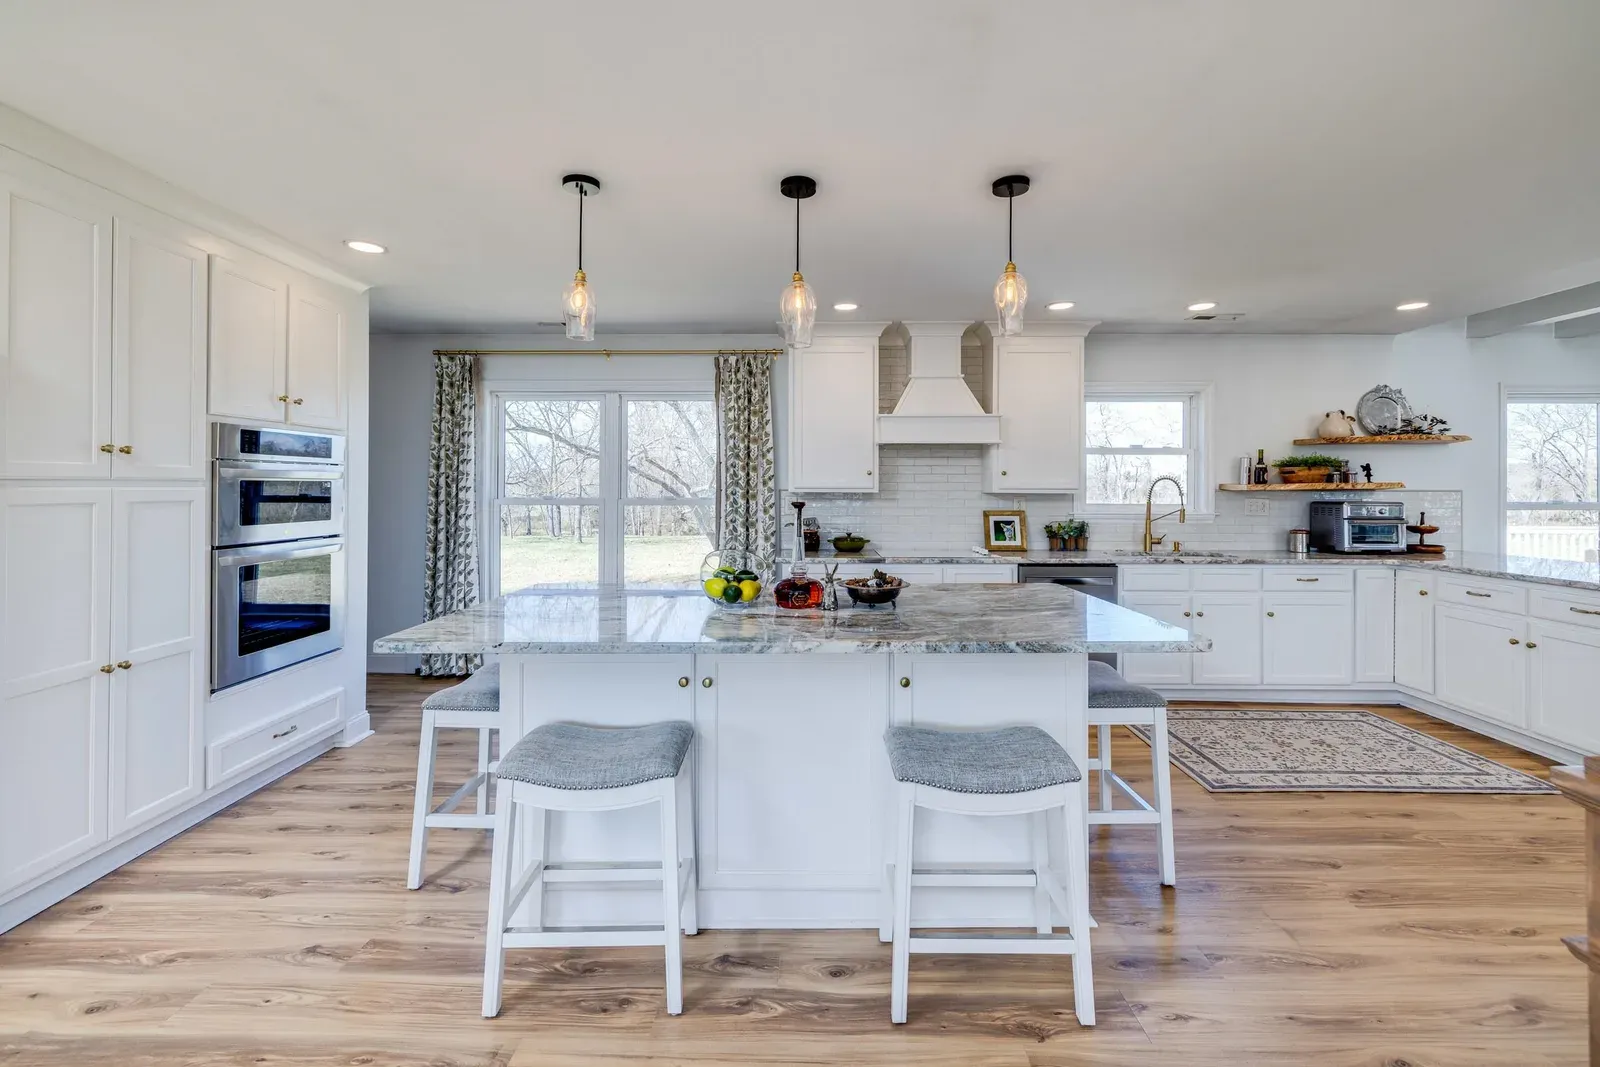
- Inside: a stone fireplace, beamed ceilings, granite kitchen counters, and a large island, plus a lower level that opens to the backyard
- Use: already approved as a short-term rental in the Town of Grottoes
- Also: no HOA, and per the listing, not in a floodplain
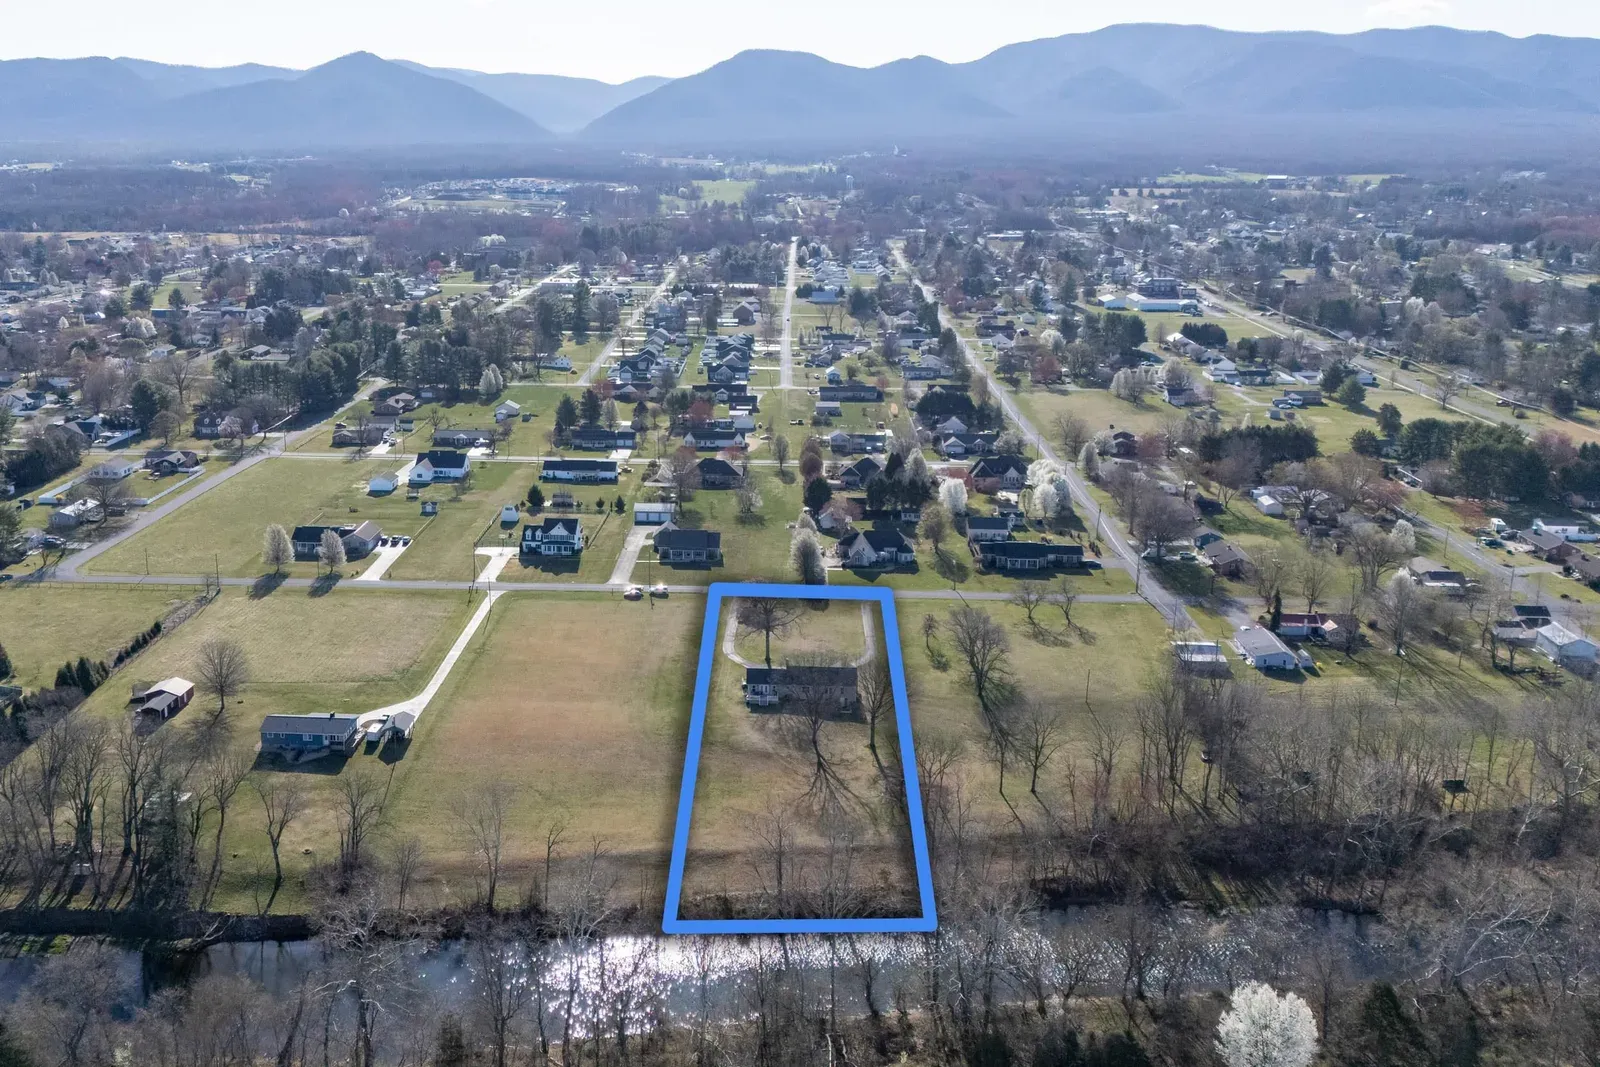
The lot, outlined, with the South River along the back edge and the Blue Ridge in the distance.
See the full listing, photos, and details
Listed by Mattias Clymer, The Valley Homes Team, Funkhouser Real Estate Group. Price and availability subject to change.
If you’re weighing a move in Harrisonburg or Rockingham County and want to talk through what these numbers mean for your home, reach out.
Data sources: Harrisonburg and Rockingham County MLS residential sales data through August 2026 (breakdown by home type through June 2026); Freddie Mac Primary Mortgage Market Survey, September 10, 2026. Featured listing details: HRAR MLS #673685. The monthly payment example is an illustration, not a loan quote. Market statistics describe past sales and do not predict future results. All real estate advertised is subject to the Federal Fair Housing Act, which makes it illegal to advertise any preference, limitation, or discrimination because of race, color, religion, sex, handicap, familial status, or national origin. Valley Homes Team is committed to equal housing opportunity.